The score is 9 - some fun with Computer Vision in Python
As I love playing darts, especially in summer, I often thought about some automatic counting system.
Of course, the easiest way would be just buying an electronic darts board, but for a steel darts player this is not an option.
Second approach would be some fancy laser scanning hacking or building circuits into the dart board.
But I’m not that familiar with building circuits and laser scanning is really prone to environmental influences.
And to be onest, locating the arrow with a well positioned laser scanner would be too easy.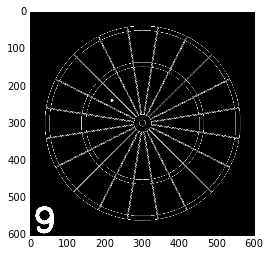
We are goint to take the rocky road and try our luck with a visual approach..
Visual approach means that our input is a camera recorded video.
Thus, The first thing we need is a video…
I want to thank Jacob D. Delaney for his very shiny work, which inspired me with some useful tricks.
You can find a copy of his project work here.
The setup
- Python 3.5
- OpenCV for Python
If you want to have a deeper look into the code, a good starting point might be the IPython Notebook
This can be launched locally with Python and Jupyter:
The full project can be found here
(Please note that this is not likely to run as the project is messed up a bit)
The starting point
The first we need to to is reading an image from camera. This can be easily done with the following code:
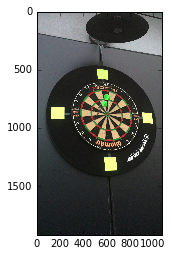
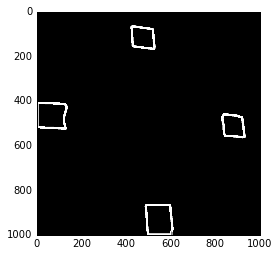
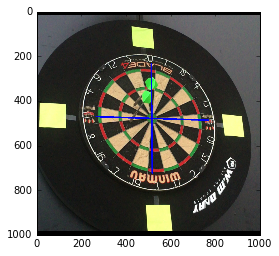
You might wonder what these nasty yellow post-its are doing. We’ll come to this later in the post (Hint: Orientation)
The dart board
In the second step I want to find my region of interest i.e. the dart board. There are various ways to do thi, but the most intuitive way might be using some kind of a template and search the image space for it.
But we will take a different technique and search for red and green pixels.
|
|
As a result we get our region of interest.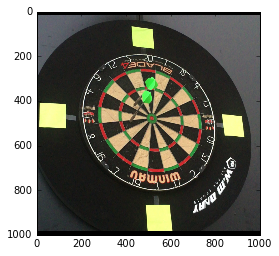
Waiting for changes
When we have our region of interest we can start monitoring the video stream for changes.
This is typically done through computing difference images.
|
|
The result of the detection looks like this: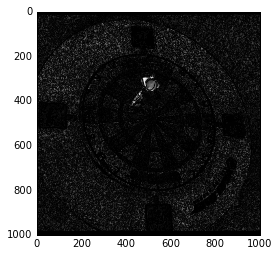
Detecting arrows
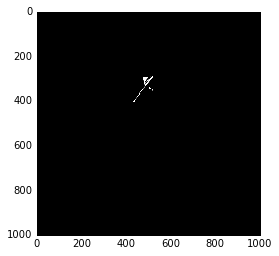
Now, we know that the video has changed. The obvious next step is to locate the arrow within the image.
With the API this can be easily done by the following lines of code.
|
|
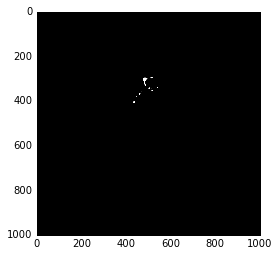
A bit more difficult (maybe the most difficult thing within this project at all) is to find the apex of an arrow.
Depending on the resolution and light condition the apex is even invisible to humans.
I take the same approach proposed by Jacob D. Delaney and first compute a line through the hole arrow and afterwards extrapolate that line until the last pixel of the arrow is reached.
|
|
This is very likely to fail most the times and you would need to take a more robost approach for a real system, but here it works as you can see in the following picture.
In a field deployment you would need to combine the information of several subsequent images and estimate the location of the apex through a state filter
Detect scoring zones
Until now we only know very little about the dart game itself. We only know something about an arrow and a dart board somwhere in the image. The more interessting part is the scoring zones. There are hundreds of ways to compute this, but we’ll take the following simple approach:
- Compute the orientation of the dart board
- Compute a transformation of the dart board to a perfect plane
- Compute the geometry of the dart board within the plane (triangles and circles of the dart board)
|
|

Next step is transforming the whole image to the plane. The result speaks for itself: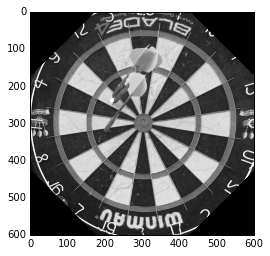
The last step is computing the geometry of the dart board artificially.
This can be done by some usual drawing.
|
|
The code produces the follwing digital dart board.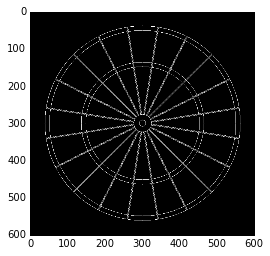
Putting it all together
Last but not least our initial task was to find out where the arrow has landed and compute the resulting score.
Until know we have all the parts together and simply need the final step: Simply apply the same transformation of the dart board to the previously computed apex location.
|
|
The result looks like this: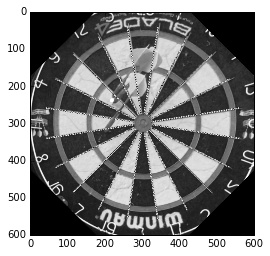
Making some beautiful output
As we all like visuality and beatiful outputs. Our very last (optional) step is to compute such an output
|
|
And here we have the final result.
The score is 9!!
Please let me know if you enjoyed the post or have any improvements. I really apperciate [sic!] reported typos and failures, too.